 Date: 2009-12-22 04:43:42
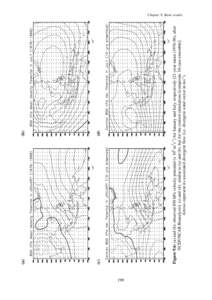
| |  (d) (c) Figure 9.6: (a) and (b): observed 850 hPa velocity potential (x 106 m2s-1) for January and July, respectively [21-year mean[removed]), after NCEP/NCAR Reanalysis]. (c) and (d): similar to (a) and (b), but for th (d) (c) Figure 9.6: (a) and (b): observed 850 hPa velocity potential (x 106 m2s-1) for January and July, respectively [21-year mean[removed]), after NCEP/NCAR Reanalysis]. (c) and (d): similar to (a) and (b), but for th
Add to Reading ListSource URL: www.cru.uea.ac.ukDownload Document from Source Website File Size: 471,32 KBShare Document on Facebook
|