Toggle navigation
PDFSEARCH.IO
Document Search Engine - browse more than 18 million documents
Sign up
Sign in
Back to Results
First Page
Meta Content
View Document Preview and Link
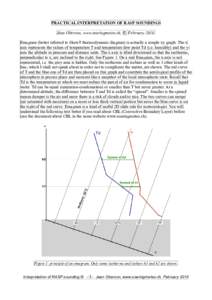
PRACTICAL INTERPRETATION OF RASP SOUNDINGS Jean Oberson, www.soaringmeteo.ch, © FebruaryEmagram (better referred to SkewT thermodynamic diagram) is actually a simple xy graph. The x axis represents the values of
Add to Reading List
Document Date: 2012-04-19 16:29:27
Open Document
File Size: 914,67 KB
Share Result on Facebook
 PRACTICAL INTERPRETATION OF RASP SOUNDINGS Jean Oberson, www.soaringmeteo.ch, © FebruaryEmagram (better referred to SkewT thermodynamic diagram) is actually a simple xy graph. The x axis represents the values of