Toggle navigation
PDFSEARCH.IO
Document Search Engine - browse more than 18 million documents
Sign up
Sign in
Back to Results
First Page
Meta Content
View Document Preview and Link
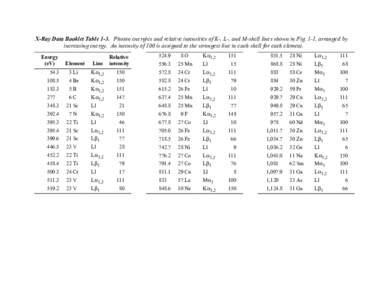
X-Ray Data Booklet Table 1-3. Photon energies and relative intensities of K-, L-, and M-shell lines shown in Fig. 1-1, arranged by increasing energy. An intensity of 100 is assigned to the strongest line in each shell fo
Add to Reading List
Document Date: 2010-12-16 11:54:30
Open Document
File Size: 155,58 KB
Share Result on Facebook
 X-Ray Data Booklet Table 1-3. Photon energies and relative intensities of K-, L-, and M-shell lines shown in Fig. 1-1, arranged by increasing energy. An intensity of 100 is assigned to the strongest line in each shell fo