Toggle navigation
PDFSEARCH.IO
Document Search Engine - browse more than 18 million documents
Sign up
Sign in
Back to Results
First Page
Meta Content
View Document Preview and Link
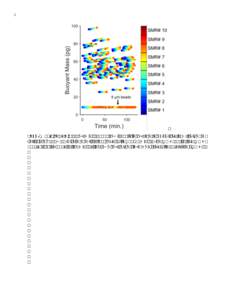
Supplementary Figure 1 Cell mass (L1210 hematopoietic cell line) is calculated from frequency shifts using 8 µm polystyrene calibration beads with known mass. Blue (SMR #1) to red (SMR #10) dots correspond to the mass o
Add to Reading List
Document Date: 2017-09-27 13:52:34
Open Document
File Size: 3,06 MB
Share Result on Facebook
 Supplementary Figure 1 Cell mass (L1210 hematopoietic cell line) is calculated from frequency shifts using 8 µm polystyrene calibration beads with known mass. Blue (SMR #1) to red (SMR #10) dots correspond to the mass o